Difference between revisions of "Timeline"
(Deleted PropertyValue: Participant = Yolanda) |
(Added PropertyValue: Participant = Yolanda Gil) |
||
| Line 8: | Line 8: | ||
<!-- Do NOT Edit below this Line --> | <!-- Do NOT Edit below this Line --> | ||
{{#set: | {{#set: | ||
| + | Participant=Yolanda_Gil| | ||
Participant=Felix}} | Participant=Felix}} | ||
Revision as of 17:06, 2 June 2014
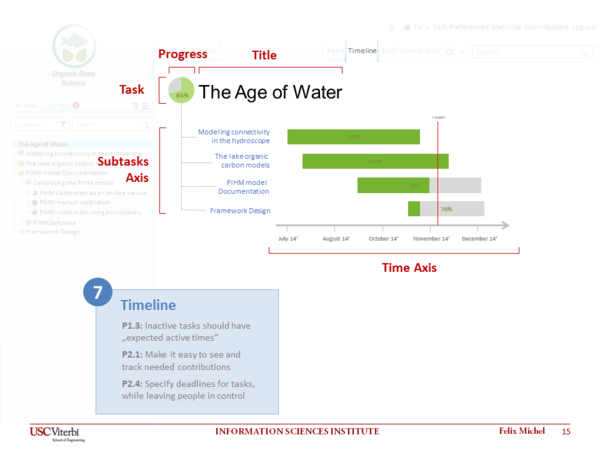
The timeline describes a task and the direct related subtasks based on time bar. The page layout of the headline is similar to the task representation. In case the selected task is no root task the parent is visible above the task headline. Basically the timeline is a simplified gant chart notation. The x-axis represents the time and each bar a single task. Every bar has a green part and a gray part which expresses the task progress. The different green colors according to the task progress tracking highlights the completed part. A vertical red line marks the current date. Bars of tasks which are in time contains a green part that is greater than the todays date. Mostly it is important know the reasons for delayed tasks. By clicking on the task name or the related bar you can zoom into this task. The selected task name moves to the heading and all the subtasks are listed. This can be done recursively until the reason is found or the leaf task is reached. This drill down is similar to the explorer navigation.
