Decay examples
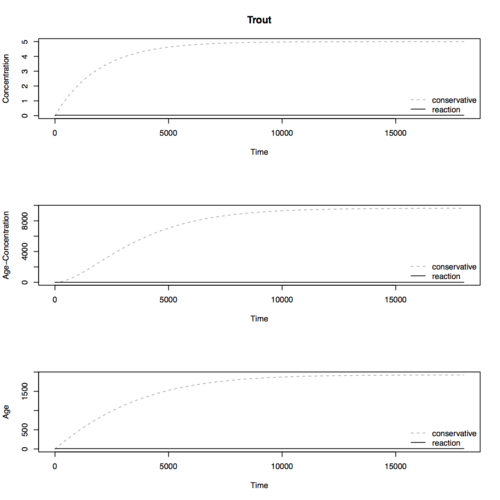
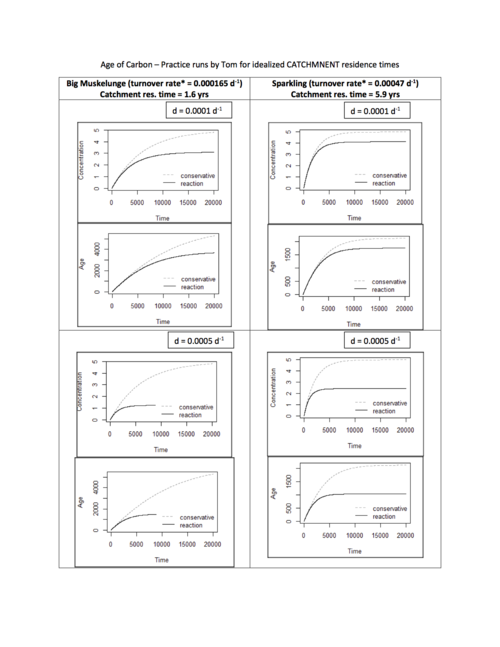
Here are some of Tom's results for an idealized catchment. The turnover rate for the catchment is estimated by dividing the groundwater velocity by a catchment length scale. For Groundwater velocity, I used Darcy's velocity (specific discharge) divided by porosity (assumed 0.35). Darcy's velocity was estimated using the catchment hydraulic conductivity (assuming it is the same throughout the catchment and with depth---huge assumption), and using the land slope as the groundwater hydraulic gradient (big assumption, well data would be much better). For the length scale, I used 1/2 x the sqrt(catchment area), which is rough--we can do better with shapefiles and some GIS work. Given all that, here are some plots for decay rates of 0.0001 d^-1, 0.0005, and 0.001, for Big Muskelunge and Sparkling Lakes--I just wanted to try some with a significant difference in catchment size.

