Difference between revisions of "Make data accessible by Xuan Yu"
From Geoscience Paper of the Future
| Line 1: | Line 1: | ||
[[Category:Task]] | [[Category:Task]] | ||
<br/><b>Details on how to do this task:</b> [[Make data accessible]]<br/><br/> | <br/><b>Details on how to do this task:</b> [[Make data accessible]]<br/><br/> | ||
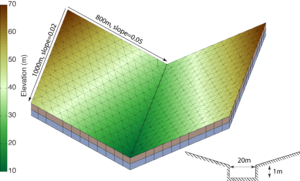
| − | PIHM has been validated by the V-catchment. Here we prepared the input files for the V-catchment simulation. The grid resolution may vary. The whole area of the V-catchment is 1.6km | + | PIHM has been validated by the V-catchment. Here we prepared the input files for the V-catchment simulation. The grid resolution may vary. The whole area of the V-catchment is 1.6km<sup>2</sup>. In this case we used 782 triangles ( the area ranges from 1534.9m<sup>2</sup> to 2379.5m<sup>2</sup>, with an average of 2046.0m<sup>2</sup>) to represent the domain [[File:Vcatchmesh.eps.png|thumb|Figure 1: PIHM mesh and domain for the V-catchment]]. The PIHM input file of the V-catchment is upload in . The users need the following step to finish the V-catchment simulation: |
| + | 1. | ||
| + | 2. | ||
Revision as of 01:55, 7 March 2015
Details on how to do this task: Make data accessible
1. 2.
The data is from the experiment in 1974, at Shale Hills, PA.
