Difference between revisions of "Make data accessible by Xuan Yu"
From Geoscience Paper of the Future
(Set PropertyValue: Progress = 100) |
|||
| (20 intermediate revisions by the same user not shown) | |||
| Line 1: | Line 1: | ||
[[Category:Task]] | [[Category:Task]] | ||
<br/><b>Details on how to do this task:</b> [[Make data accessible]]<br/><br/> | <br/><b>Details on how to do this task:</b> [[Make data accessible]]<br/><br/> | ||
| − | + | We provide two data sets for the PIHM modeling (we use PIHM2.2 to avoid any discrepancy). | |
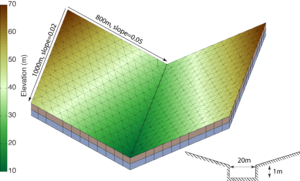
| + | The first case is a benchmark problem: V-catchment. Here we prepared the input files for the V-catchment simulation. The V-catchment is benchmark example for the 2-D overland surface flow coupled with channel routing [http://dx.doi.org/10.1016/S0022-1694(96)80014-X "P. Di Giammarco et al., 1996"]. In the benchmark example, a rainfall event of 90-minute duration, 3e-6 m/s is applied on the V-catchment. The runoff at the outlet is usually compared for model validation. In this section, we shows how to use PIHM simulate the rainfall-runoff response of the V-catchment. PIHM uses a triangular mesh to represent the domain. The grid resolution may vary according to the users' requirement. Here, we used 782 triangles ( the area ranges from 1534.9m<sup>2</sup> to 2379.5m<sup>2</sup>, with an average of 2046.0m<sup>2</sup>) to represent the domain[[File:Vcatchmesh.eps.png|thumb|Figure 1: PIHM mesh and domain for the V-catchment. The geometry of the catchment and the channel is from [http://dx.doi.org/10.1016/S0022-1694(96)80014-X "P. Di Giammarco et al., 1996"]]]. The users need the following steps to finish the V-catchment simulation:<br> | ||
| + | <li>1. Install PIHM on your computer.</li> | ||
| + | <li>2. Download input files of V-catchment at [http://dx.doi.org/10.6084/m9.figshare.1328521]. </li> | ||
| + | <li>3. Run PIHM by the command "./pihm". </li> | ||
| + | <li>4. Plot the column 18 of "vcat.rivFlx1". </li> | ||
| + | You will be able to see the runoff response as Figure 2. [[File:Vcat.png|thumb|Figure 2: PIHM modeled hydrograph of the V-catchment]] | ||
| − | The data is from the experiment in 1974, at Shale Hills, PA. | + | Another simulation is PIHM application at a real watershed. Please find the details about the original application at [http://dx.doi.org/10.1029/2006WR005752 "Qu and Duffy, 2007"]. Here we demonstrate how to reproduce the simulation. The watershed data is from the experiment in 1974, at Shale Hills, PA. The rainfall runoff responses are shown in Figure 3[[File:1974.eps.png|thumb|Figure 3: Rainfall runoff responses during the irrigation experiment in 1974.]]. |
<!-- Add any wiki Text above this Line --> | <!-- Add any wiki Text above this Line --> | ||
<!-- Do NOT Edit below this Line --> | <!-- Do NOT Edit below this Line --> | ||
| Line 11: | Line 17: | ||
Expertise=Geosciences| | Expertise=Geosciences| | ||
Owner=Xuan_Yu| | Owner=Xuan_Yu| | ||
| − | Progress= | + | Progress=100| |
StartDate=2015-02-21| | StartDate=2015-02-21| | ||
TargetDate=2015-03-06| | TargetDate=2015-03-06| | ||
Type=Low}} | Type=Low}} | ||
Latest revision as of 20:35, 26 March 2015
Details on how to do this task: Make data accessible
We provide two data sets for the PIHM modeling (we use PIHM2.2 to avoid any discrepancy).

Figure 1: PIHM mesh and domain for the V-catchment. The geometry of the catchment and the channel is from "P. Di Giammarco et al., 1996"

