Difference between revisions of "Write about the evaluation"
(Set PropertyValue: Progress = 100) |
|||
| (25 intermediate revisions by one user not shown) | |||
| Line 1: | Line 1: | ||
[[Category:Task]] | [[Category:Task]] | ||
| + | We evaluated our collaborative framework approach with the organic data science wiki. Currently this wiki has 18 registered users, thereof 12 active users and contains 122 Tasks. After the features has been rolled out we instrument our framework. Within 10 weeks we collected around 19,000 log entities. All task pages together have been accessed more than 2,900 times. All person pages together have been accessed 328 times. | ||
| + | |||
| + | ==How easy is it for new people to participate?== | ||
| + | Our approach to lower the participation barrier is to provide our users a trainings wiki with several tasks to train. The trainings tasks follow the documentation structure and guides the new users practicing relevant topics. To evaluate how valuable the documentation in combination with the training we evaluate: | ||
| + | |||
| + | <i> '''How often is the documentation accessed after training?''' </i> | ||
| + | |||
| + | |||
| + | How often tasks are deleted short after creation by the same user? One user deleted in sum 3 tasks within five minutes after creation. This happened during he accomplished the trainings tasks in the trainings wiki. | ||
| + | |||
| + | <i>'''What is the new user’s total training time?'''</i> | ||
| + | |||
| + | ==How do users find relevant tasks?== | ||
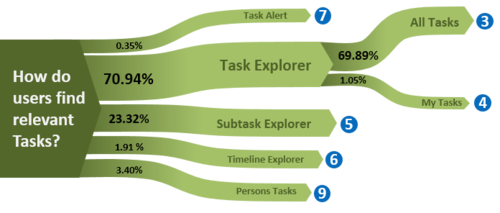
| + | We analyzed the log data of our self-implemented java-script tracking tool. We measured how tasks pages are opened. Most users used the task explorer navigation to find their relevant pages. This is probably because users have overview over all tasks. At the same time it is possible to find relevant tasks quickly with a drill down or certain filters. The task alert not used that often but we expect that this feature will be more important a rising amount of tasks over time. | ||
| + | |||
| + | [[File:Paper_evaluation_findingtasks.png|500px]] | ||
| + | |||
| + | ==Where are collaboration touch points?== | ||
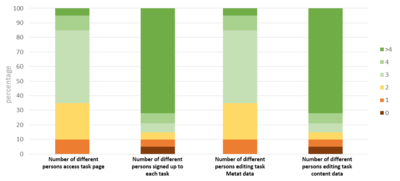
| + | To measure the collaboration we split this question into four sub questions. The system contains 122 tasks but the total number of tasks for the following questions can be higher or lower due to the reason that tasks can be renamed or deleted. We do not consider results where no persons are involved due to that this tasks are just created. All results are illustrated in Figure 9. | ||
| + | |||
| + | <i>'''A: Is more than one person viewing the task page?'''</i> | ||
| + | Currently 48 percentage of all task pages are accessed by only one person. The high vale is due to the reason that we consider also new created pages. The percentage of new create pages is in a new wiki comparable high. | ||
| + | |||
| + | <i>'''B: Is more than one person signed up for each task?'''</i> | ||
| + | For the evaluation we count the participants and add one person for the owner if set. With 32 percentage it is most common that 3 persons are assigned to a task. Tasks with two person | ||
| + | |||
| + | <i>'''C: Is more than one person editing task metadata?'''</i> | ||
| + | Currently 81 percentage of all tasks metadata is edited by only one percentage. The task creator often also adds the initial metadata which leads to such high percentage. Around 16 of the tasks metadata is edited by 2 persons. | ||
| + | |||
| + | <i>'''D: Is more than one person editing the content of tasks?'''</i> | ||
| + | The result of this question has a similarity with previous question. The tasks content is edited to 88 percentage by one person and around 10 percentage of two persons. | ||
| + | |||
| + | [[File:paper_evaluation_taskcollaboration.png|400px]] | ||
| + | |||
| + | ==Is a person collaborating with more than on other person?== | ||
| + | We used the tasks metadata attributes to evaluate this. Every task has a metadata attribute owner and participants. We created an artificial users set collaborators which combines the owner and participants. In the next step we created user-collaboration pairs and counted how often they collaborate on tasks. The result is illustrated in Figure 10. Users are represented as nodes and the number of tasks they have in common is expressed with the strength of edges. It is simply visible that there are basically two strong collaborations exist. This spread collaboration groups exist because we there are two main goals. The smaller collaboration group is developing this organic data science framework and the larger group represents the researchers which use this framework to accomplish their science goals. | ||
| + | |||
| + | [[File:Paper_evaluation_personnetwork.png|400px]] | ||
| + | |||
| + | ==First Ideas== | ||
Possible dimensions for evaluation: | Possible dimensions for evaluation: | ||
| Line 14: | Line 54: | ||
# show how people track their own tasks. Here we would do a survey to ask how easy it is for people to track tasks. | # show how people track their own tasks. Here we would do a survey to ask how easy it is for people to track tasks. | ||
| − | Survey with categories 1 to 10: | + | ::Survey with categories 1 to 10: |
| − | + | ::#My Task Tab | |
| − | + | ::#Task Alert | |
| − | + | ::#Person Page | |
| − | + | ::#Expertise | |
Need to show ''collaboration touch points'': | Need to show ''collaboration touch points'': | ||
| Line 25: | Line 65: | ||
::{| class="wikitable" | ::{| class="wikitable" | ||
! Nr of Participants | ! Nr of Participants | ||
| + | ! #Task | ||
! Tasks in % | ! Tasks in % | ||
|- | |- | ||
| − | | 0 | + | | 0 || 11 || 9.01% |
| − | | | + | |
|- | |- | ||
| − | | 1 | + | | 1 || 27 || 22.13% |
| − | | | + | |
|- | |- | ||
| − | | 2 | + | | 2 || 33 || 27.04% |
| − | | | + | |
|- | |- | ||
| − | | 3 | + | | 3 || 36 || 29.50% |
| − | | 50 | + | |
|- | |- | ||
| − | | 4 | + | | 4 || 14 || 11.47% |
| − | | | + | |
|- | |- | ||
| − | | >4 | + | | >4 || 1 || 0.81% |
| − | | | + | |
|} | |} | ||
| − | ::Data Source: JSON Serialized Tasks. | + | ::Data Source: JSON Serialized Tasks.<br/> |
| + | <!--::Results from 15th of Septembre:<br/>--> | ||
| + | <!--::[[File:Paper_persons_per_task.png|300px]]<br/>--> | ||
| + | ::[[File:PersonPercentageGraph.png|400px]]<br/> | ||
# is more than one person editing the metadata of tasks? | # is more than one person editing the metadata of tasks? | ||
::{| class="wikitable" | ::{| class="wikitable" | ||
! Nr of Meta Data Editors | ! Nr of Meta Data Editors | ||
| + | ! #Tasks | ||
! Tasks in % | ! Tasks in % | ||
|- | |- | ||
| − | | 1 | + | | 1 || 141 || 78.77% |
| − | | | + | |
|- | |- | ||
| − | | 2 | + | | 2 || 27 || 15.08% |
| − | | | + | |
|- | |- | ||
| − | | 3 | + | | 3 || 7 || 3.91% |
| − | | | + | |
|- | |- | ||
| − | | 4 | + | | 4 || 4 || 2.23% |
| − | | | + | |
|- | |- | ||
| − | | >4 | + | | >4 || 0 || 0% |
| − | | | + | |
|} | |} | ||
::Data Source: Tracking Data. | ::Data Source: Tracking Data. | ||
| Line 73: | Line 107: | ||
::{| class="wikitable" | ::{| class="wikitable" | ||
! Nr of Content Editors | ! Nr of Content Editors | ||
| + | ! #Tasks | ||
! Tasks in % | ! Tasks in % | ||
|- | |- | ||
| − | | 1 | + | | 1 || 210 || 87.50% |
| − | | | + | |
|- | |- | ||
| − | | 2 | + | | 2 || 25 || 10.42% |
| − | | 25 | + | |
|- | |- | ||
| − | | 3 | + | | 3 || 3 || 1.25% |
| − | | | + | |
|- | |- | ||
| − | | 4 | + | | 4 || 0 || 0% |
| − | | | + | |
|- | |- | ||
| − | | >4 | + | | >4 || 2 || 0.84% |
| − | | | + | |
|} | |} | ||
::Data Source: Wiki Logs. | ::Data Source: Wiki Logs. | ||
| + | |||
| + | # is person collaborating with more than one other person? | ||
| + | ::Data Source: JSON Serialized Tasks. | ||
| + | <br/> | ||
| + | ::'''Collaboration network:''' Every node represents an organic data science user. The strength of collaboration between users is expressed with strength of each edge.<br/> | ||
| + | ::[[File:PersonNetworkv0.1.png|400px]] | ||
| Line 96: | Line 132: | ||
<!-- Do NOT Edit below this Line --> | <!-- Do NOT Edit below this Line --> | ||
{{#set: | {{#set: | ||
| − | |||
Expertise=Computer_science| | Expertise=Computer_science| | ||
| + | Expertise=Collaboration| | ||
Owner=Felix_Michel| | Owner=Felix_Michel| | ||
Participants=Yolanda_Gil| | Participants=Yolanda_Gil| | ||
| − | Progress= | + | Progress=100| |
StartDate=2014-09-12| | StartDate=2014-09-12| | ||
TargetDate=2014-09-29| | TargetDate=2014-09-29| | ||
Type=Low}} | Type=Low}} | ||
Latest revision as of 19:18, 9 October 2014
We evaluated our collaborative framework approach with the organic data science wiki. Currently this wiki has 18 registered users, thereof 12 active users and contains 122 Tasks. After the features has been rolled out we instrument our framework. Within 10 weeks we collected around 19,000 log entities. All task pages together have been accessed more than 2,900 times. All person pages together have been accessed 328 times.
Contents
How easy is it for new people to participate?
Our approach to lower the participation barrier is to provide our users a trainings wiki with several tasks to train. The trainings tasks follow the documentation structure and guides the new users practicing relevant topics. To evaluate how valuable the documentation in combination with the training we evaluate:
How often is the documentation accessed after training?
How often tasks are deleted short after creation by the same user? One user deleted in sum 3 tasks within five minutes after creation. This happened during he accomplished the trainings tasks in the trainings wiki.
What is the new user’s total training time?
How do users find relevant tasks?
We analyzed the log data of our self-implemented java-script tracking tool. We measured how tasks pages are opened. Most users used the task explorer navigation to find their relevant pages. This is probably because users have overview over all tasks. At the same time it is possible to find relevant tasks quickly with a drill down or certain filters. The task alert not used that often but we expect that this feature will be more important a rising amount of tasks over time.
Where are collaboration touch points?
To measure the collaboration we split this question into four sub questions. The system contains 122 tasks but the total number of tasks for the following questions can be higher or lower due to the reason that tasks can be renamed or deleted. We do not consider results where no persons are involved due to that this tasks are just created. All results are illustrated in Figure 9.
A: Is more than one person viewing the task page? Currently 48 percentage of all task pages are accessed by only one person. The high vale is due to the reason that we consider also new created pages. The percentage of new create pages is in a new wiki comparable high.
B: Is more than one person signed up for each task? For the evaluation we count the participants and add one person for the owner if set. With 32 percentage it is most common that 3 persons are assigned to a task. Tasks with two person
C: Is more than one person editing task metadata? Currently 81 percentage of all tasks metadata is edited by only one percentage. The task creator often also adds the initial metadata which leads to such high percentage. Around 16 of the tasks metadata is edited by 2 persons.
D: Is more than one person editing the content of tasks? The result of this question has a similarity with previous question. The tasks content is edited to 88 percentage by one person and around 10 percentage of two persons.
Is a person collaborating with more than on other person?
We used the tasks metadata attributes to evaluate this. Every task has a metadata attribute owner and participants. We created an artificial users set collaborators which combines the owner and participants. In the next step we created user-collaboration pairs and counted how often they collaborate on tasks. The result is illustrated in Figure 10. Users are represented as nodes and the number of tasks they have in common is expressed with the strength of edges. It is simply visible that there are basically two strong collaborations exist. This spread collaboration groups exist because we there are two main goals. The smaller collaboration group is developing this organic data science framework and the larger group represents the researchers which use this framework to accomplish their science goals.
First Ideas
Possible dimensions for evaluation:
- show how easy it is for new people to participate. For example, show total training time, show how often they go back to consult documentation, show how often they delete things they have created because they made mistakes, etc. Could also do a survey of new users. New users will include: Jordan, Craig, Hilary, Gopal (anyone else?).
- show how people find relevant tasks. For example, show how they use search, how they get to tasks they want to do, etc.
- show how people track their own tasks. Here we would do a survey to ask how easy it is for people to track tasks.
- Survey with categories 1 to 10:
- My Task Tab
- Task Alert
- Person Page
- Expertise
- Survey with categories 1 to 10:
Need to show collaboration touch points:
- is more than one person signed up to each task?
Nr of Participants #Task Tasks in % 0 11 9.01% 1 27 22.13% 2 33 27.04% 3 36 29.50% 4 14 11.47% >4 1 0.81%
- is more than one person editing the metadata of tasks?
Nr of Meta Data Editors #Tasks Tasks in % 1 141 78.77% 2 27 15.08% 3 7 3.91% 4 4 2.23% >4 0 0%
- Data Source: Tracking Data.
- is more than one person editing the content text of tasks?
Nr of Content Editors #Tasks Tasks in % 1 210 87.50% 2 25 10.42% 3 3 1.25% 4 0 0% >4 2 0.84%
- Data Source: Wiki Logs.
- is person collaborating with more than one other person?
- Data Source: JSON Serialized Tasks.


