Difference between revisions of "Write about the evaluation"
From Organic Data Science Framework
(Set PropertyValue: TargetDate = 2014-09-29) |
(Set PropertyValue: Progress = 95) |
||
| Line 96: | Line 96: | ||
Owner=Felix_Michel| | Owner=Felix_Michel| | ||
Participants=Yolanda_Gil| | Participants=Yolanda_Gil| | ||
| − | Progress= | + | Progress=95| |
StartDate=2014-09-12| | StartDate=2014-09-12| | ||
TargetDate=2014-09-29| | TargetDate=2014-09-29| | ||
Type=Low}} | Type=Low}} | ||
Revision as of 00:07, 5 October 2014
Possible dimensions for evaluation:
- show how easy it is for new people to participate. For example, show total training time, show how often they go back to consult documentation, show how often they delete things they have created because they made mistakes, etc. Could also do a survey of new users. New users will include: Jordan, Craig, Hilary, Gopal (anyone else?).
- show how people find relevant tasks. For example, show how they use search, how they get to tasks they want to do, etc.
- If the tracked data has a certain variation we could represent the conversation rate of components.

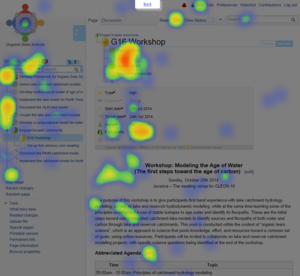
- We can add additional heat maps to illustrate where the users focus on.


- show how people track their own tasks. Here we would do a survey to ask how easy it is for people to track tasks.
- Survey with categories 1 to 10:
- My Task Tab
- Task Alert
- Person Page
- Expertise
- Survey with categories 1 to 10:
Need to show collaboration touch points:
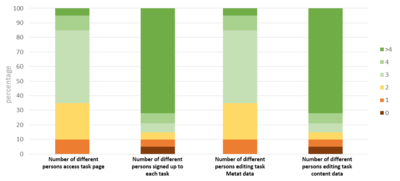
- is more than one person signed up to each task?
Nr of Participants #Task Tasks in % 0 11 9.01% 1 27 22.13% 2 33 27.04% 3 36 29.50% 4 14 11.47% >4 1 0.81%
- Data Source: JSON Serialized Tasks.
- Data Source: JSON Serialized Tasks.

- is more than one person editing the metadata of tasks?
Nr of Meta Data Editors #Tasks Tasks in % 1 141 78.77% 2 27 15.08% 3 7 3.91% 4 4 2.23% >4 0 0%
- Data Source: Tracking Data.
- is more than one person editing the content text of tasks?
Nr of Content Editors #Tasks Tasks in % 1 210 87.50% 2 25 10.42% 3 3 1.25% 4 0 0% >4 2 0.84%
- Data Source: Wiki Logs.
- is person collaborating with more than one other person?
- Data Source: JSON Serialized Tasks.
- Collaboration network: Every node represents an organic data science user. The strength of collaboration between users is expressed with strength of each edge.

- Collaboration network: Every node represents an organic data science user. The strength of collaboration between users is expressed with strength of each edge.
