Difference between revisions of "Exploring Tasks"
(Creating new page with Category: Docu) |
(Creating new page with Category: Docu) |
||
| Line 1: | Line 1: | ||
[[Category:Docu]] <!--Do not edit this page manually the docu is generated via XML Script and will override manual edits!--><table id="wt-documentation" cellspacing="0" cellpadding="0"> <tr> <td class="content"> | [[Category:Docu]] <!--Do not edit this page manually the docu is generated via XML Script and will override manual edits!--><table id="wt-documentation" cellspacing="0" cellpadding="0"> <tr> <td class="content"> | ||
| − | The wiki | + | The Organic Data Science wiki framework enables scientists to collaborate in new ways doing what we call “task-oriented collaboration”. |
| + | The wiki poses some broad overarching science questions that cut across disciplines and institutions. Answering those questions requires | ||
| + | contributors to formulate and collaborate in a variety of tasks through the ODS framework, such as decomposing the high level questions | ||
| + | into smaller tasks, sharing datasets, describing data characteristics, preparing them, and running models. Therefore, a major aspect of | ||
| + | the framework is to understand how tasks work. Several top-level tasks are formulated to capture the driving science questions, each with | ||
| + | subtasks which have other subtasks in turn<br/><br/> | ||
Tasks of the organic data science framework can be browsed in many different ways. | Tasks of the organic data science framework can be browsed in many different ways. | ||
Revision as of 14:13, 12 September 2014
|
The Organic Data Science wiki framework enables scientists to collaborate in new ways doing what we call “task-oriented collaboration”.
The wiki poses some broad overarching science questions that cut across disciplines and institutions. Answering those questions requires
contributors to formulate and collaborate in a variety of tasks through the ODS framework, such as decomposing the high level questions
into smaller tasks, sharing datasets, describing data characteristics, preparing them, and running models. Therefore, a major aspect of
the framework is to understand how tasks work. Several top-level tasks are formulated to capture the driving science questions, each with
subtasks which have other subtasks in turn Tasks of the organic data science framework can be browsed in many different ways.
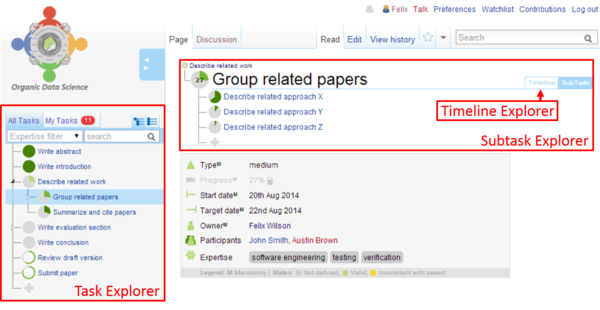
Depending on your purpose you can choose between the task explorer, the subtask explorer
and the timeline explorer. The best choice to browse within all tasks is the task explorer, which appears on the left side of the screen.
In case you want to browse subtasks of a certain task you should use the subtask explorer.
Alternatively you can use the timeline explorer to browse subtasks and see their time dependencies.
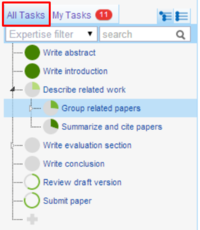
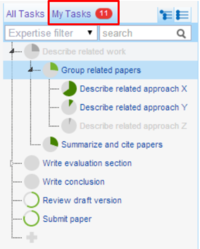
The following figure illustrates these three different task browsing options. ContentsTask ExplorerThe Task Explorer appears on the left of the screen. It shows all tasks in the wiki organized in a tree hierarchy, with subtasks indented. This Task Explorer works comparable with the file browser in a desktop. By default all top level task are visible. Every task with a small triangle has at least one subtask, and can be expanded with a left mouse click on the triangle. The wiki page for any task can be opened with a single left mouse click on the task name. All Tasks TabThis tab of the Task Explorer shows all existing tasks in the wiki. You can use this to explore tasks within the wiki. My Tasks TabThis tab of the Task Explorer shows all tasks that you own. All other tasks are invisible or greyed out. Parent tasks which are needed to
represent the task hierarchy are greyed out. A red counter behind the tab label indicates how many tasks you have currently assigned to you as owner.
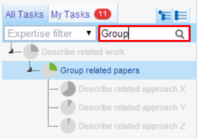
The My Tasks tab is only visible for users who are logged in. Task Name SearchThe Task Name Search allows you to search the task names. You can apply this search either
to the All Tasks tab or the My Tasks tab. All matching results are shown in the Task Explorer.
Parent tasks of matching tasks are shown but faded, just to provide context. Expertise FilterThe Expertise Filter works similar to the Task Name Search, but it searches for tasks that are marked with the expertise indicated.
It offers a pull-down menu with the kinds of expertise already defined in the wiki.
The pull-down menu shows in brackets a number that indicates how many tasks have that expertise. After
selecting a certain expertise, the matching tasks are shown. The Task Name Search and the
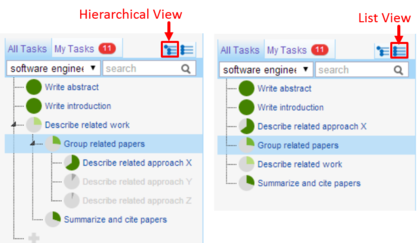
Expertise Filter can be combined. If both are applied, all results shown will match both criteria. Hierarchical View and List ViewThe Task Explorer can show two different views of the tasks: the hierarchical view
and the list view. The hierarchical view shows the task-subtask hierarchy, and is the default view.
Furthermore the amount of tasks is smaller due to the nested task structure.
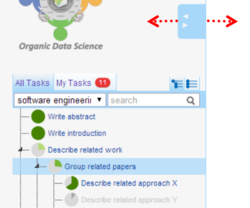
The list view does not show a parent or subtask hierarchy. The list view is more convenient when the hierarchy view shows a lot of faded tasks. ResizingSome task names are only partially shown because they are simply too long. Therefore you can resize the width of the Task Explorer.
Hover the mouse over the blue rectangle with the white arrows to the left and right. After that, left click, then
hold and then move to the left or move to the right. Subtask ExplorerThe Subtask Explorer is basically to browse subtasks of the task currently opened in the wiki page.
The name of the current task shown in the wiki page is larger and the task icon is more detailed
with a number that indicates the percentage of the task that is completed (this will be explained later).
Above the current task name, the parent task is shown if there is one.
Below it, all its subtasks are listed and can be expanded. Timeline ExplorerThe timeline explorer can be opened with click on the blue Timeline tab on the top right.
Similar to the subtask explorer, all subtasks of the current task are shown. The Timeline Explorer
shows all subtasks in a time context comparable to a Gantt chart. The x-axis represents the time, and each bar shows a subtask. A number within
a bar represents the progress of that subtask. Today's date is marked with a vertical red line. Every task can be
opened with a simple click. | Organic Data Science Framework Documentation Contribute as Participant Exploring Tasks Participating on Tasks Person Page Basic Task States Contribute as Owner Create Task Task Alert Organize Tasks Extended Task States |
